Image: UKOOG
A long-awaited visualisation of what shale gas production could mean for the UK countryside has been released by the fracking industry.
The Thirsk and Malton MP Kevin Hollinrake, who asked for the visualisation at a meeting with the industry in February last year, said it could build confidence among residents in shale areas.
But opponents of fracking, who have been waiting for the release for more than 11 months, dismissed it as misleading and unhelpful.

Image: UKOOG
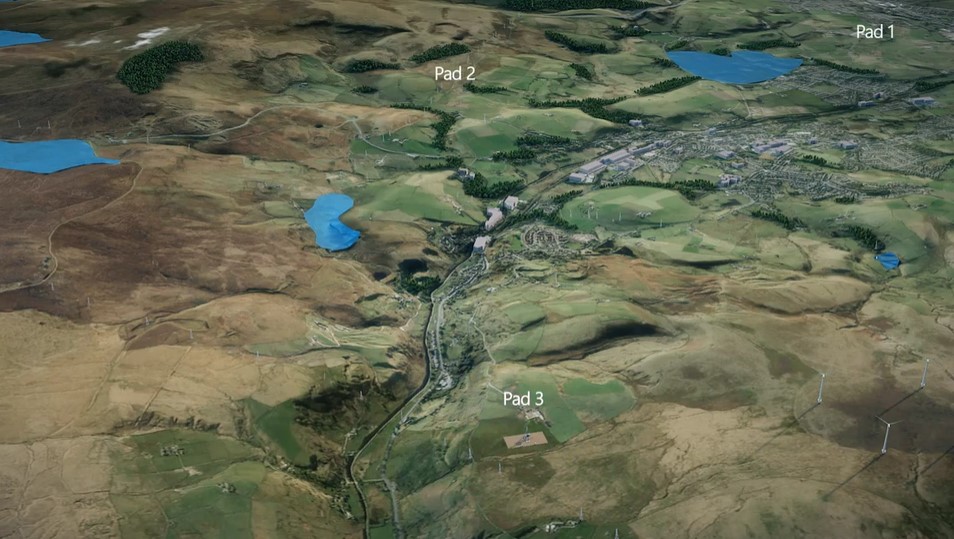
The work, commissioned by the industry body, UK Onshore Oil and Gas, is a 5-minute 3D video of two petroleum exploration and development licences, said to be typical of shale gas areas. It is accompanied by a report “Developing Shale Gas and Maintaining the Beauty of the British Countryside“.
The visualisation shows three well pads in each 10km by 10km licence. The report, however, predicts 7-11 pads in a 10km by 10km licence. Both the visualisation and the report suggest there would be about 10 wells on each pad.
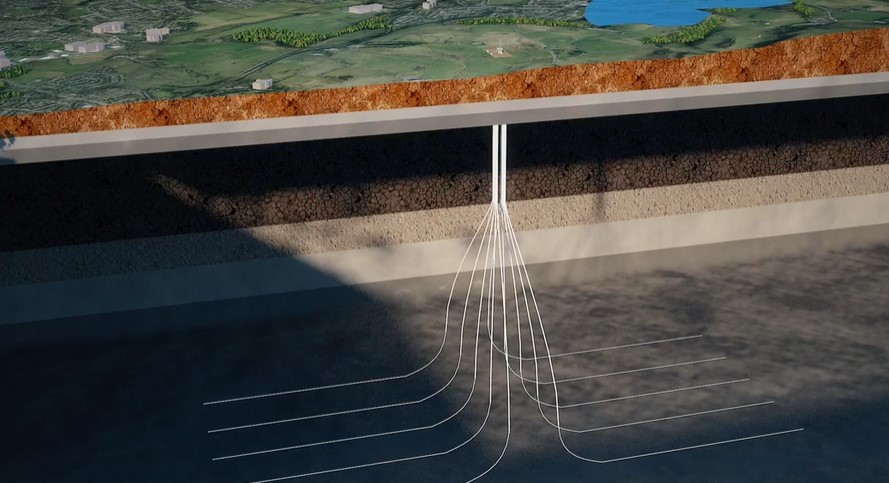
Image: UKOOG
UKOOG said the video demonstrated the low impact of potential shale development in the UK. It compared drilling rigs favourably with the height of wind turbines and transmitter towers.
Ken Cronin, chief executive of UKOOG, said:
“We estimate that approximately 400 well pads developed across the UK between 2020 and 2035 could reduce our gas import dependency by at least 50%. This compares to 88,000 pylons, 9,000 municipal waste water treatment facilities and 5,300 individual wind turbines that already exist.
“Producing sites will involve a temporary construction and drilling phase and will have no permanent drilling rigs or other tall structures and will be quiet and, with screening, not visible.”
But opponents said the visualisation did not show the infrastructure that would accompany shale gas well pads, such as new roads, waste tanks, pipelines, processing plant, compressor stations and treatment centres.
They also said the number of pads and wells was far lower than that predicted by Cuadrilla in 2015 for one of its licence areas (40 wells per pad and 80-100 pads in PEDL165).
Answering questions
Kevin Hollinrake said he had asked for a visualisation to answer questions from constituents about what fracking would look like in North Yorkshire. He told DrillOrDrop:
“I am happy with it as an illustration. I think there’s still some detail that we’ve got to get right in terms of the defining guidelines and defining policy.”
Asked if it would convince people, he said:
“Somebody who is open minded, as I am, I think it will build confidence, which is the reason we asked for it to be done.
“We wanted the reassurances that this could be done properly. We needed to see a tangible and visual illustration so it will be interesting to see the feedback that we get.
“People who are concerned or who are open minded, hopefully, they will feel that this is a useful illustration of how things can be.”
“Not convinced”
But members of Frack Free Ryedale, a campaign group opposing shale gas in the area between Malton and Pickering, were not convinced by the visualisation.
Jo White, who visited fracking areas in Pennsylvania, said drilling and fracking needed trucks, pumps, chemicals, sand and water.
“Industrialisation of the countryside isn’t just the pad you end up with at the end. It is also the activity and use of the countryside. Thousands and thousands of trucks thundering through the countryside, drilling noise, fracking noise, dust and vibration on this scale is industrialisation of the countryside. That is a planning fact.
“What about showing all the pipe laying, compressor stations, processing plants and all the new waste treatment plants they will need. And there doesn’t appear to be any access roads which scar the landscape badly.”
Jo’s husband, Steve, described the visualisation as “professionally done, but just not credible”. He said:
“The animation shows 2 PEDL licence areas, yet only shows a total of 6 well pads. This conflicts with industry telling us “only” 10 pads per licence area. So roughly a third of what they’re admitting to now.
“Professor Andy Aplin’s view (Durham University), based on international experience, is that 33,000 wells across 5,000 pads would be needed to make us self-sufficient in gas. This seems to be an order of magnitude discrepancy in well numbers. “
David Davis, a claimant in the High Court challenge to the decision to allow fracking at Kirby Misperton, said the visualisation was a poor representation. It did not, he said, show noise attenuation barriers around sites while the screens of trees, which appeared to grow very quickly in the visualisation, would take 20-30 years to reach that height. He said:
“Given that the conventional sites in Ryedale are much closer together than the ones on the visualisation one can only remain sceptical of the likely true extent of well density.”
He added that drilling time would be difficult to reduce on a multi-well pad because two rigs working at the same time would exceed allowed noise levels.
Ian Conlan, from Malton, said:
“This is a highly selective glossy PR exercise with a so-called bird’s eye view that is unrealistic: more like cloud cuckoo land.
“What about the dreadful 24/7 drilling noises needed for thousands of wells, instead of the mood music of this video specifically designed to distract residents from the dreadful reality of living next to the drilling of a fracking well in the middle of the night?”
Peter Allen, another member of Frack Free Ryedale, said:
“This is singularly unhelpful. If I was Kevin Hollinrake I would be very embarrassed that a presentation that could have been knocked up in half an hour on a home computer has taken a year to complete and at the end of the day tells us nothing except that in the producer’s opinion there is less visual impact than the alternatives. If Kevin Hollinrake was in my class I would tell him to go home and do his homework again!”
“Threat to water”
Another opponent of fracking, Professor Peter Strachan, of Robert Gordon University, told DrillOrDrop:
“What concerns me about this short film is that it is clear that fracking will take place near to environmentally sensitive bodies of water. From exploration, drilling, lifting, transportation and eventual disposal of contaminated sludge, absolutely no indication is given as to how such precious water resources will be protected from the toxic effects of the entire fracking life-cycle.
“I can only conclude that this is yet another desperate attempt from an industry keen to win public acceptance. The general public is already highly sceptical of the claims made by the fracking industry. The frackwash presented in this film is unlikely to convince many. I doubt very much that the English general public will be hoodwinked by such industry propaganda.”
“Industry not in charge of the process”
Mr Hollinrake said the shale gas industry should not decide on well density.
Asked by DrillOrDrop about the disparity in the number of wellpads between the video and report, Mr Hollinrake said:
“I don’t think it matters what the [shale gas] producers say, what the industry says, they should not be in charge of this process.
“I’m grateful to them for producing the visualisation but in terms of the restriction that should apply to shale gas exploration and development that must be through regulation, through planning regulation and environmental regulation. We don’t have to ask the producers not to over-develop, we tell them through the planning process.”
The draft minerals local plan for North Yorkshire had proposed a maximum of 10 wellpads in a 10km by 10km area. Mr Hollinrake said this could be reduced to five or six well pads because of restrictions of protected areas, towns and villages and poor access. Mr Hollinrake said:
“If there was a perfect PEDL licence area that was 100 sq km area that had no issues about access, no protected areas, no villages in it, then you probably could get 10 pads. But realistically, you take all those things into account you’re going to be looking at a lower number, it could be five or six. It would depend on the area.
“Hopefully other local authorities will adopt the North Yorkshire approach: that government and local authorities set the criteria, rather than the industry. I think that’s absolutely crucial that representatives of the local area have the ultimate say in this.”
Links
“Developing Shale Gas and Maintaining the Beauty of the British Countryside”
Categories: Industry


I suspect that almost any detail can be seen from earth orbiting satellites, perhaps that also depends upon the limitations of camera definition and and azimuth. The term deep space could mean from the other end of the universe, if indeed there is an end. Close orbiting satellites are in either Low Earth orbit (LEO): geocentric orbits with altitudes from 160 to 2,000 km (100–1,240 miles). Medium Earth orbit (MEO): geocentric orbits ranging in altitude from 2,000 km (1,240 miles) to just below geosynchronous orbit at 35,786 kilometers (22,236 mi). I suspect that the LEO’s would be most suitable, we are told that some military satellites could read a newspaper from orbit (probably “The Sun”!) So i suspect almost any surface detail could be seen from orbit.
Oil and Gas exploration on the surface can certainly be seen from satellites in surprising detail
[Image removed over possible copyright issues]
One could only guess that this is what UK will look like in a few years time?
[Image removed over possible copyright issues]
Always the same old tired arguments, if its not wind farms its bovine flatulence? Something about splinters and planks perhaps?
http://en.openei.org/wiki/Map_of_Wind_Farms
I count 1144 wind farm sites as opposed to 1.7 million oil and gas sites, that’s about 0.067% wind farm sites compared to O&G sites. These massive wind farms are a distraction of the real issue anyway, and that is small local wind, solar and efficient technology devices such as Quantum Generators that i referred to recently are the sustainable way to go, it has never been the same old centralized energy monopolies of oil and gas or even centralized wind and solar, that is just preserving the same old blinkered monopolies.
I notice that some are very quick to jump in and produce the same old tired damage limitation exercises, what will it be next? Gas central heating? Driving cars without fossil fuels? Protesters using propane?
http://en.openei.org/wiki/Map_of_Wind_Farms
Look at the maps of what UK may look like in the future above and tell me if 1.7 million compared to 1144 is an accurate representation or not?
Interactive renewables map in UK:
http://www.renewables-map.co.uk/renewable%20energy.asp
[Image removed over possible copyright issues]
What will UK fracking look like?
This is another link to initially the State of Pennsylvania, and further links to all Pennsylvania counties and operators, this shows the number of sites and the number of violations and fines Statewide
http://stateimpact.npr.org/pennsylvania/drilling/
As a guide to what we may see in UK, there are 1.7 million wells in USA, statewide statistics are severely limited (one might say obscured and obfuscated) because of no national documentation data recording and presentation standard,
This is the most technically advanced continent on the planet, and this is the best they can do?
Relevant information is buried in .pdf and multiple files and not easy to correlate or extract, no wonder statistics are thrown about, there is no real way of correlating this reliably, it leaves everything open to interpretation, Que Bono?
https://www.fractracker.org/2015/08/1-7-million-wells/
[Image removed over possible copyright issues]
UK satellite image of off shore London Array wind farm:
http://www.dailymail.co.uk/sciencetech/article-2543995/A-picture-thatll-blow-away-Satellite-image-reveals-650-turbines-worlds-largest-wind-farm-Kent-SPACE.html
Just dots on the image, perhaps we are looking at camera definition and height restrictions and trying to compare images, its a pity that the images do not have height and resolution information.
Just for balance this is a map of high medium and low ecological sensitivity, also applicable to wind farms of course.
Click to access Onshore_wind_sensitivity_2015_tcm9-432921.pdf
Perhaps the two examples I posted are onshore Phil? You hardly need access roads and lay down pads offshore – they use boats and jack ups to transport and install them. Offshore oil and gas often is just one or two platforms covering 100km2.
Can the RSPB map also be used for drilling rig sites? Would make sense as a drilling rig is not 135m high or spinning at high speed with blades over 50m long?
Or thousands of O&G sites in a similar area? Look at these, i would say that the big three bladed towers will quickly become obsolescent and removed, i would be happy to have these locally, not in big wind farms but local and efficient near to if not in the community.
Add solar and Quantum Energy Generators and we have the future right here.
http://quantumenergygenerator.com/
http://www.seao2.com/vawt/
The UK landscape could be transformed, look at the tulip and flower and art turbines, quite beautiful, all more efficient than the obsolete three bladed types.