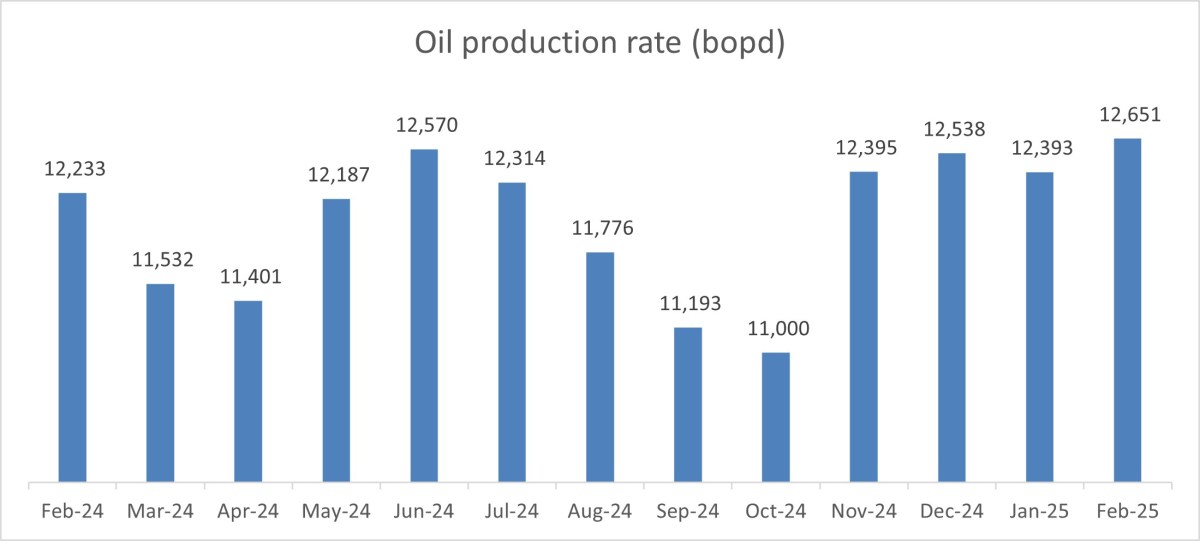
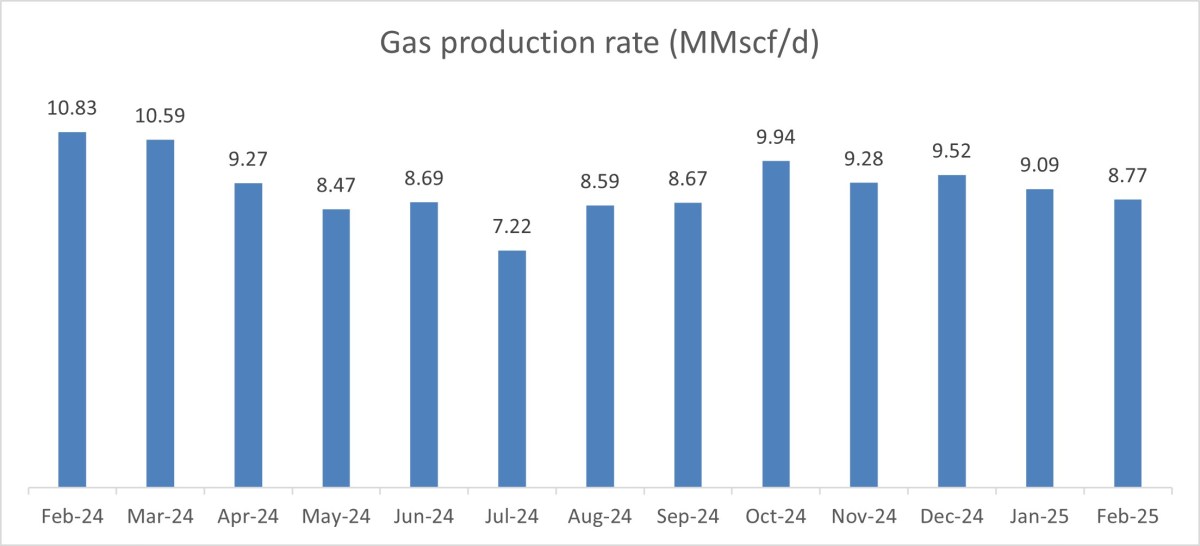
UK onshore oil daily production rose 2% in February 2025, compared with the previous month but daily onshore gas production dropped 4%.mm
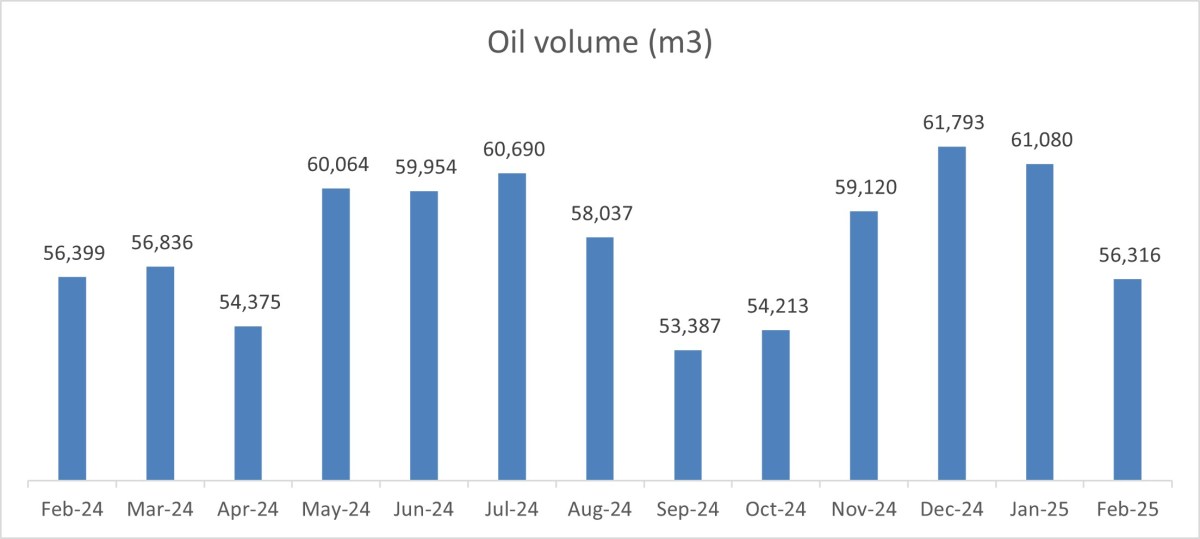
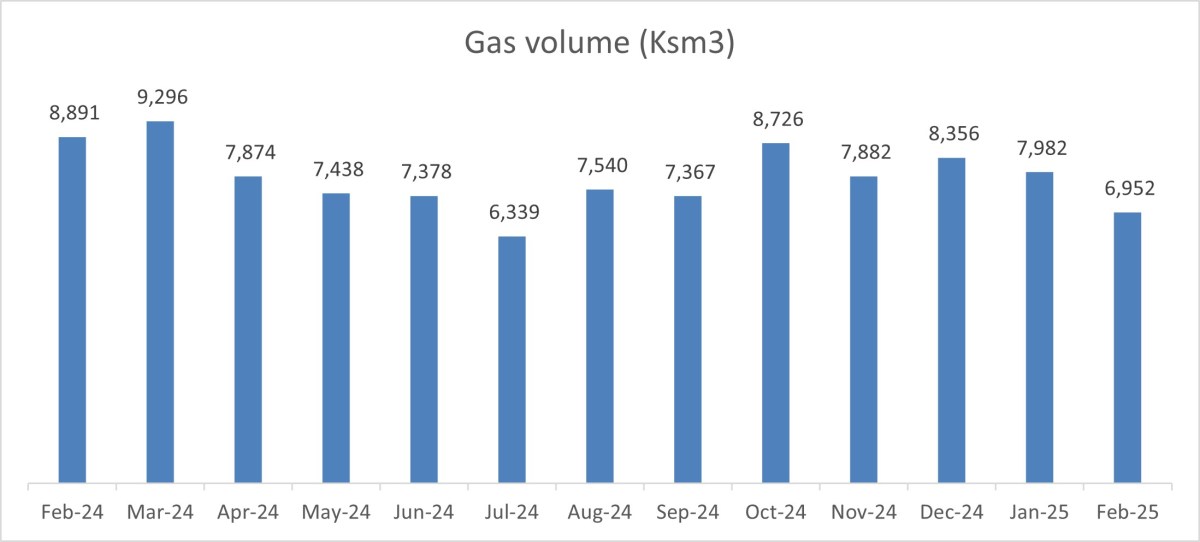
Total onshore oil volume for February 2025 fell 8% – but not as much as would have been expected from the shorter month. Total gas volume for the month was down 13% – more than would be explained by the fewer production days.
Key figures
Daily oil production: 12,651 barrels of oil per day (bopd)
January 2025 12,393bopd, December 2024 12,538bopd, November, 12,395bopd, October 11,000bopd, September 11,193 bopd, August 11,776 bopd, July 12,314 bopd
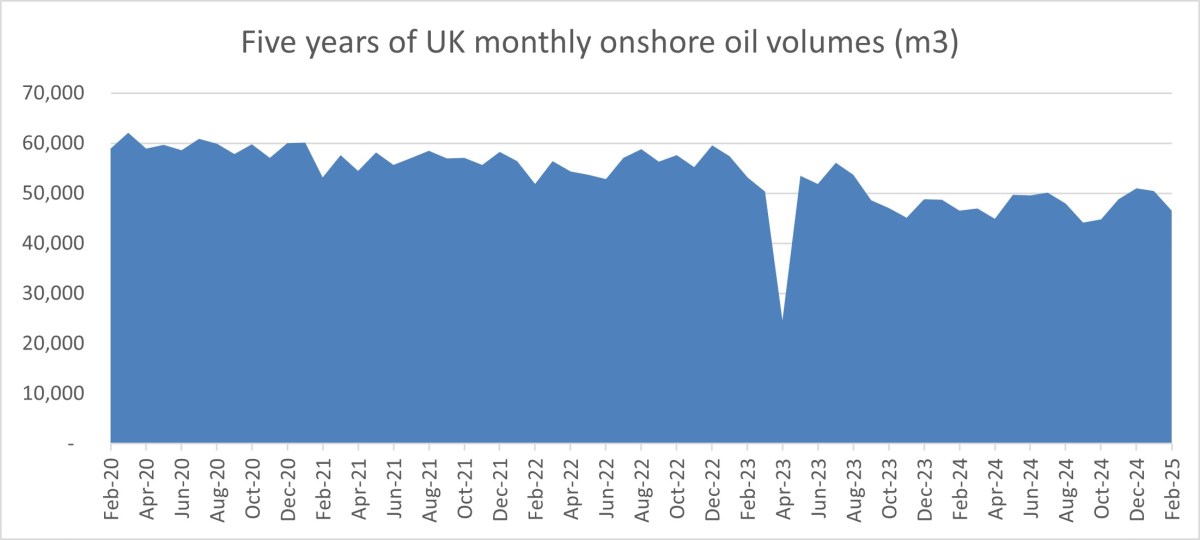
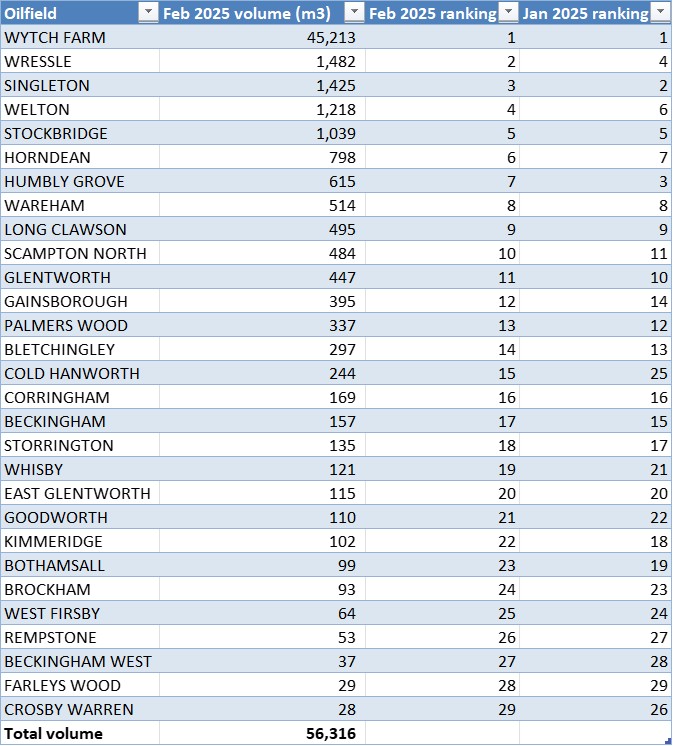
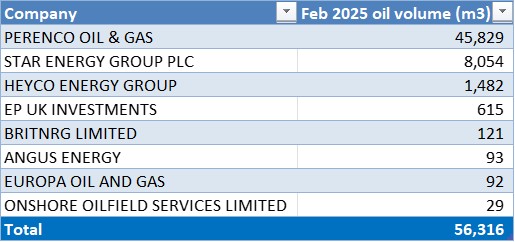
Oil volume: 56,316m3
January 2025 61,080m3, December 2024 61,793m3, November 2024 59,120m3, October 2024 54,213m3, September 2024 53,387m3, August 2024 58,037m3, July 2024 60,690m3
Oil weight: 46,520 tonnes
January 2025 50,444 tonnes, December 2024 51,029 tonnes, November 2024 48,858 tonnes, October 2024 44,849 tonnes, September 2024 44,133 tonnes, August 2024 47,948 tonnes, July 2024 2024 50,148 tonnes
Daily gas production: million standard cubic feet per day (mmscf/d): 8.77mmscf/d
January 2025 9.09mmscf/d, December 2024 9.52 mmscf/d, November 2024 9.28 mmscf/d, October 2024 9.94 mmscf/d, September 2024 8.67 mmscf/d, August 2024 8.59 mmscf/d, July 2024 7.22 mmscf/d
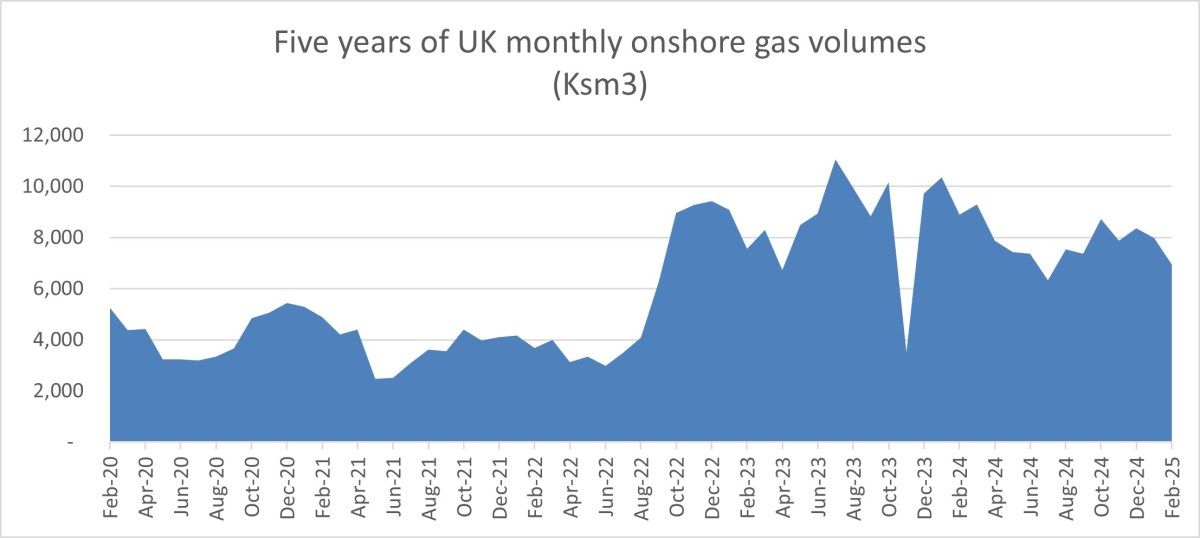
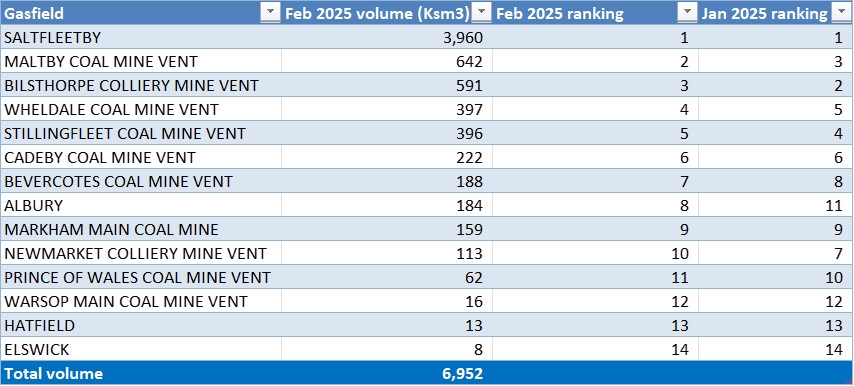
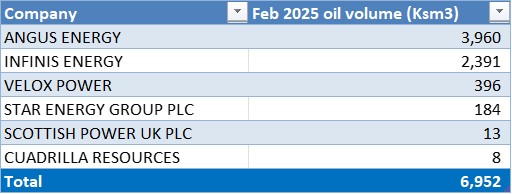
Gas volume: thousand standard cubic meters (Ksm3): 6,952ksm3
January 2025 7,982ksm3, December 2024 8,356ksm3, November 2024 7,882ksm3, October 2024 8,726Ksm3, September 2024 7,367Ksm3, August 2024 7,540Ksm3, July 2024 6,339Ksm3
Gas weight: 5,478 tonnes
January 2025 6,273 tonnes, December 2024 6,652 tonnes, November 2024 6,291 tonnes, October 2024 6,861 tonnes, September 2024 6,034 tonnes, August 2024 6,186 tonnes, July 2024 5,143 tonnes
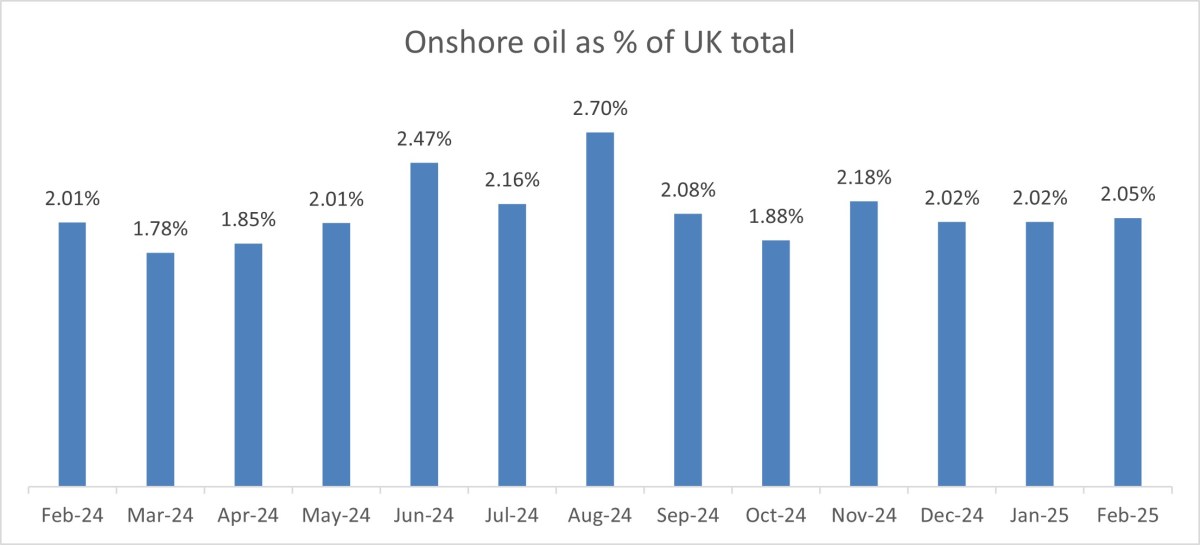
Onshore oil’s contribution to UK total production: 2.05%
January 2025 2.02%, December 2024 2.02%, November 2024 2.18%, October 2024 1.88%, September 2024 2.08%, August 2024 2.70%, July 2024 2.16%
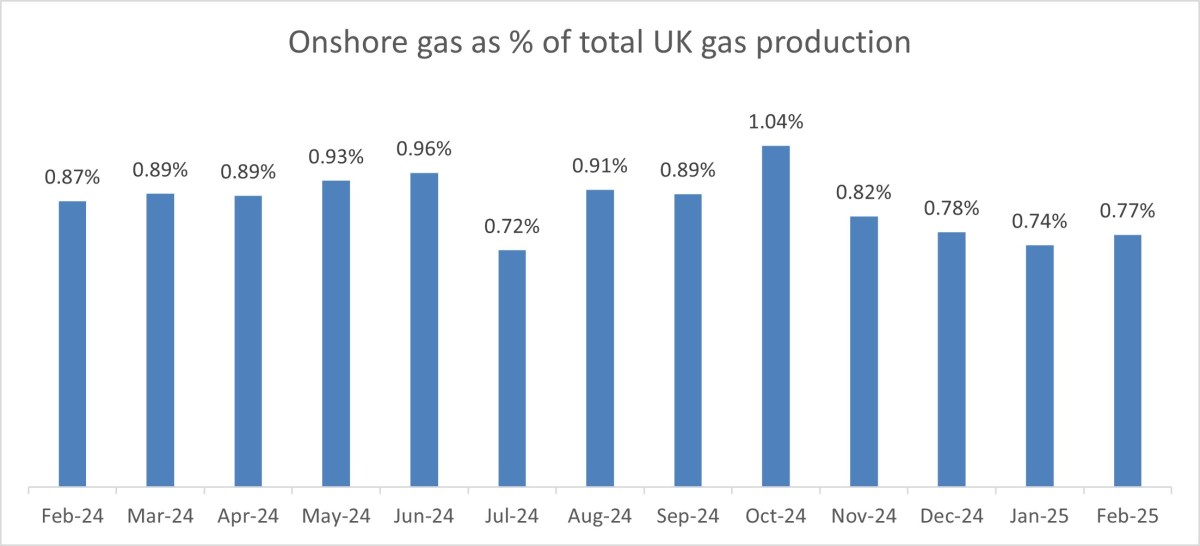
Onshore gas’s contribution to UK total production: 0.77%
January 2025 0.74%, December 2024 0.78%, November 2024 0.82%, October 2024 1.04%, September 2024 0.89%, August 2024 0.91%, July 2024 0.72%
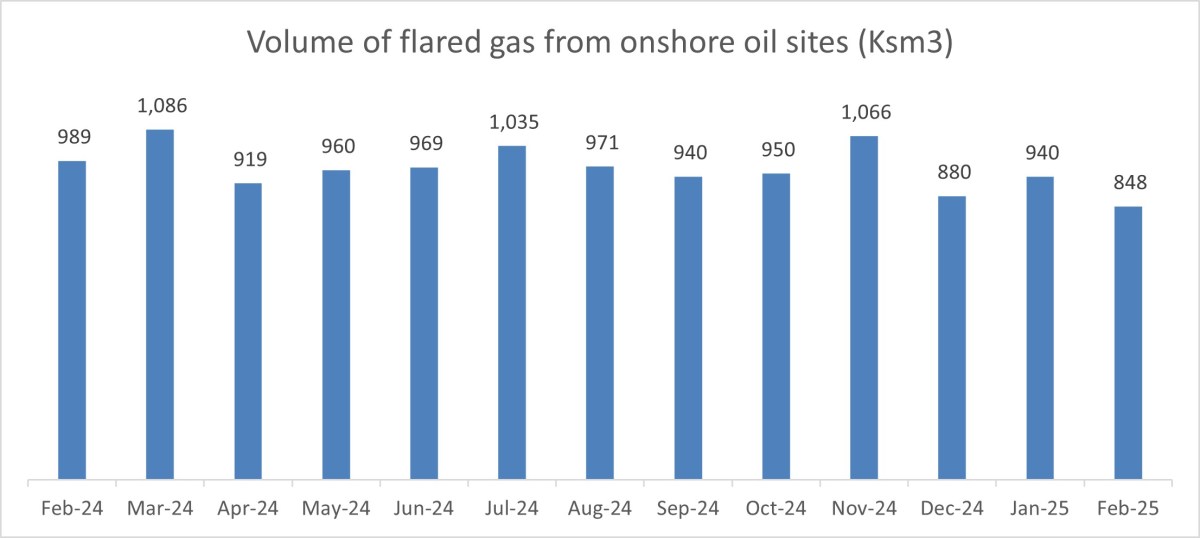
Volume of flared gas at UK onshore oil fields: 848ksm3
January 2025 940ksm3, December 2024 880ksm3, November 2024 1,067m3, October 2024 951 ksm3, September 2024 943 ksm3, August 2024 975 ksm3, July 2024 1,035ksm3
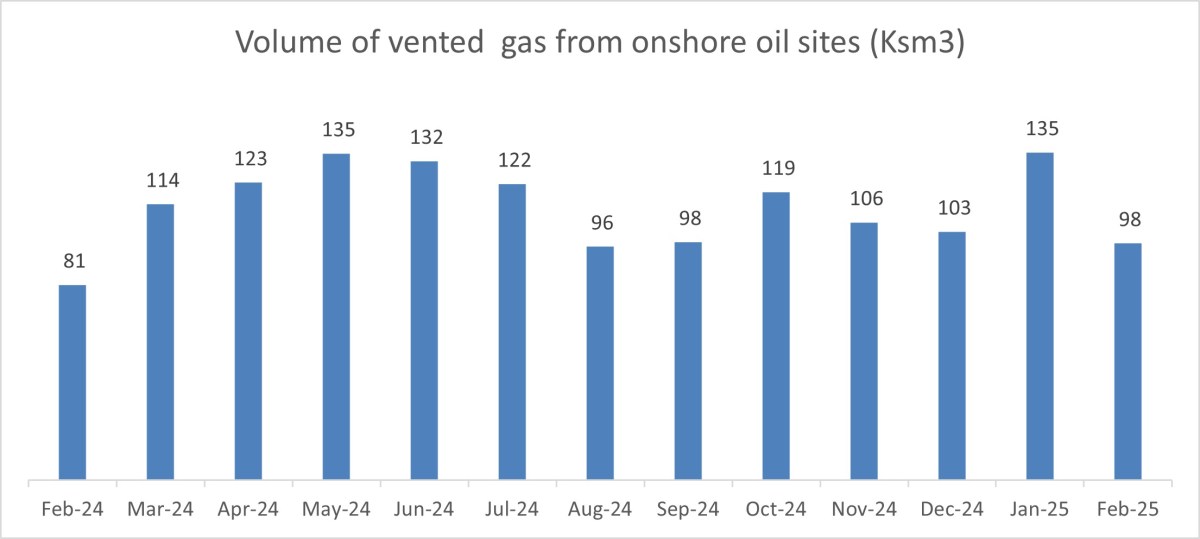
Volume of vented gas at UK onshore oil fields: 98ksm3
January 2025 135ksm3, December 2024 103ksm3, November 2024 106ksm3, October 2024 119 ksm3, September 2024 98ksm3, August 2024 100ksm3, July 2024 123ksm3
Volume of produced water at UK onshore oil fields: 1,280,605m3
New data field – we will add past data in the coming months
Volume of reinjected produced water at UK onshore oil fields: 1,266,963m3
New data field – we will add past data in the coming months
Volume of produced water at UK onshore gas fields: 176m3
New data field – we will add past data in the coming months
Number of onshore fields which recorded some oil production in February 2025: 29
January 2025 29, December 2024 29, November 2024 30,October 2024 30, September 2024 31, August 2024 31, July 2024 31
Number of onshore fields which recorded some gas production in February 2025: 14
January 2025 15, December 2024 15, November 2024 11, October 2024 13, September 2024 8, August 2024 7, July 2024 8
Number of onshore producing fields which recorded no oil production in February 2025: 14
January 2025 14, December 2024 14, November 2024 13, October 2024 13, September 2024 12, August 2024 12, July 2024 12
Number of onshore producing fields which recorded no gas production in
February 2025: 11
January 2025 11, December 2024 10, November 2024 15, October 2024 13, September 2024 17, August 2024 18, July 2024 16
This article uses data compiled and published by the North Sea Transition Authority (NSTA) from reports by oil and gas companies. This is published about three months in arrears. All the charts are based on the NSTA data. Occasionally, figures change retrospectively.
Details
Daily production
Volume and weight


Contribution to total UK production
Flaring and venting
Producing fields
Oil


Gas
Non-producing fields
Oil
The February 2025 data shows there was no production at 14 UK onshore oilfields. This was the same number and fields as in January 2025 and December 2024.
The non-producing fields were again:
- Angus Energy: Lidsey
- Britnrg Limited: Newton-on-Trent
- Heyco (formerly Egdon Resources): Dukes Wood, Fiskerton Airfield, Keddington, Kirklington, Waddock Cross
- HHDL/UKOG: Horse Hill
- Star Enery (formerly IGas): Avington, Egmanton, Nettleham, Scampton, South Leverton, Stainton
Gas
There was no production from 11 onshore fields in February 2025, according to the data. This was the same number as in January 2025. Mansfield coal mine vent produced no gas but Hatfield returned to production
The list of non-producing fields is:
- Heyco: Kirkleatham
- EP UK Investments: Humbly Grove Gas Storage
- Ineos: Airth, Doe Green
- Infinis Energy: coal mine vents at Askern, Florence, Gedling, Kings Mill Hospital, Mansfield Sherwood and Whitwell
Operators
Oil
Gas
2022-2025 onshore oil data archive
August 2022 – see note about revised data
July 2022 – see note about revised data
DrillOrDrop has closed the comments section on this and future articles. We are doing this because of the risk of liability for copyright infringement in comments. We still want to hear about your reaction to DrillOrDrop articles. You can contact us by clicking here.

