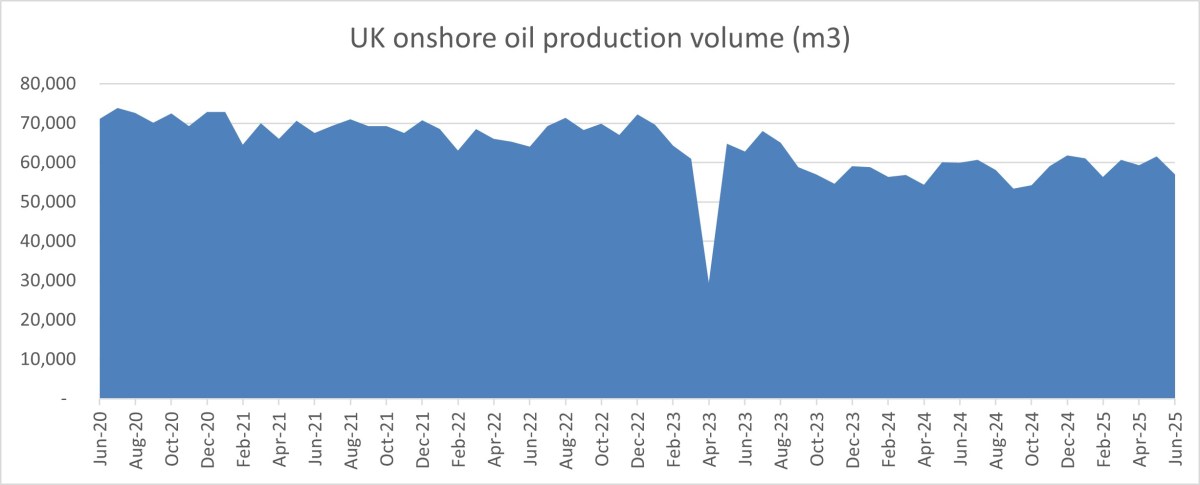
UK onshore daily oil production in June 2025 was the lowest for eight months. The monthly oil volume dropped 7% compared with the month before. The fall was more than twice what would have been expected from the shorter month in June, compared with May 2025.
The fall was largely because of a drop in production at the UK’s largest onshore producer, Wytch Farm, after five consecutive months of increase.
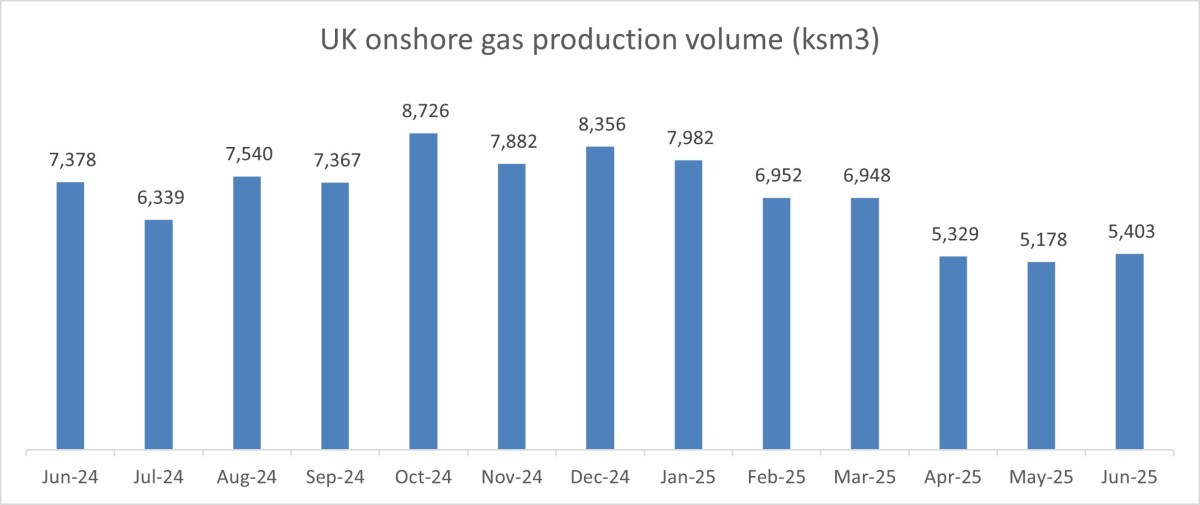
Monthly onshore gas volume rose 4% in June 2025, despite the shorter month. Daily production rose for the second consecutive month but still remained well below the peak of autumn 2024 and winter 2024/2025.
Key figures
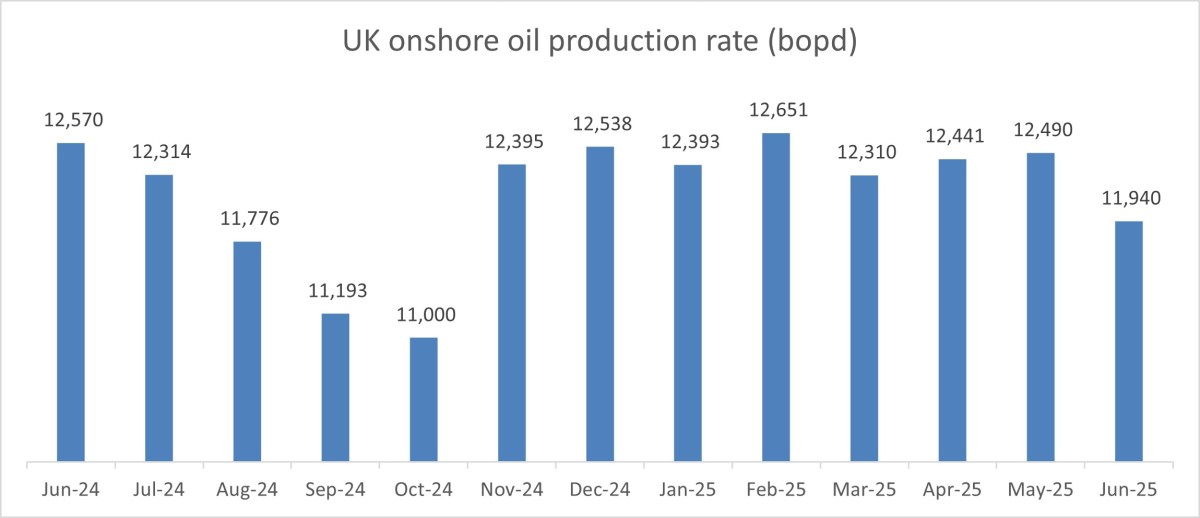
Daily oil production: barrels of oil per day (bopd): 11,940bopd
May 2025 12,490bopd, April 2025 12,441bopd, March 2025 12,310 bopd, February 2025 12,651bopd, January 2025 12,393bopd, December 2024 12,538bopd, November, 12,395bopd, October 11,000bopd, September 11,193 bopd, August 11,776 bopd, July 12,314 bopd
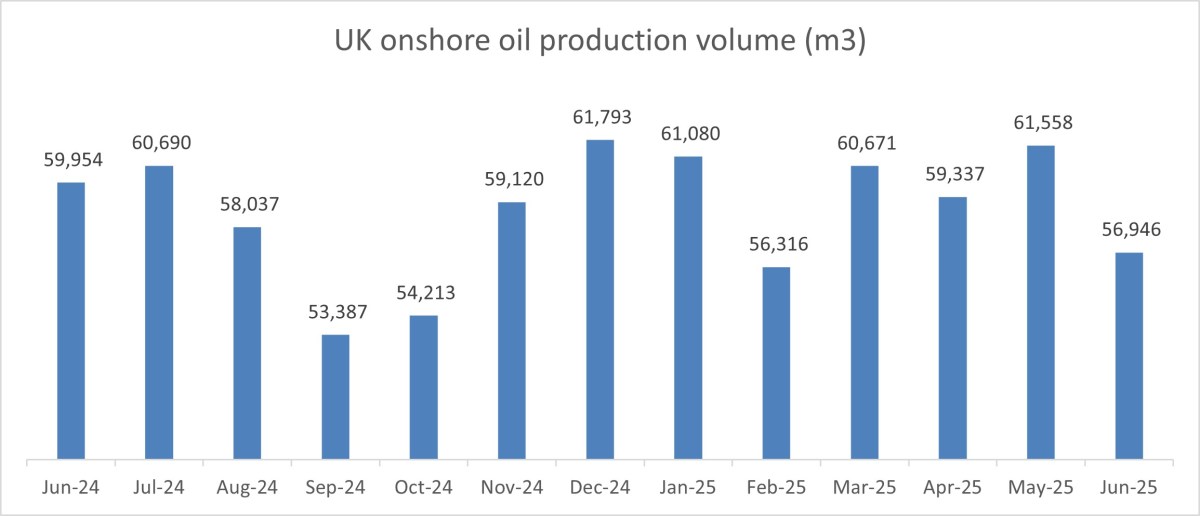
Oil volume: 56,946m3
May 2025 61,558m3, April 2025 59,337m3, March 2025 60,671m3, February 2025 56,316m3, January 2025 61,080m3, December 2024 61,793m3, November 2024 59,120m3, October 2024 54,213m3, September 2024 53,387m3, August 2024 58,037m3, July 2024 60,690m3
Oil weight: 47,043 tonnes
May 2025 50,857 tonnes, April 2025 49,000 tonnes, March 2025 50,079 tonnes, February 2025 46,520 tonnes, January 2025 50,444 tonnes, December 2024 51,029 tonnes, November 2024 48,858 tonnes, October 2024 44,849 tonnes, September 2024 44,133 tonnes, August 2024 47,948 tonnes, July 2024 2024 50,148 tonnes
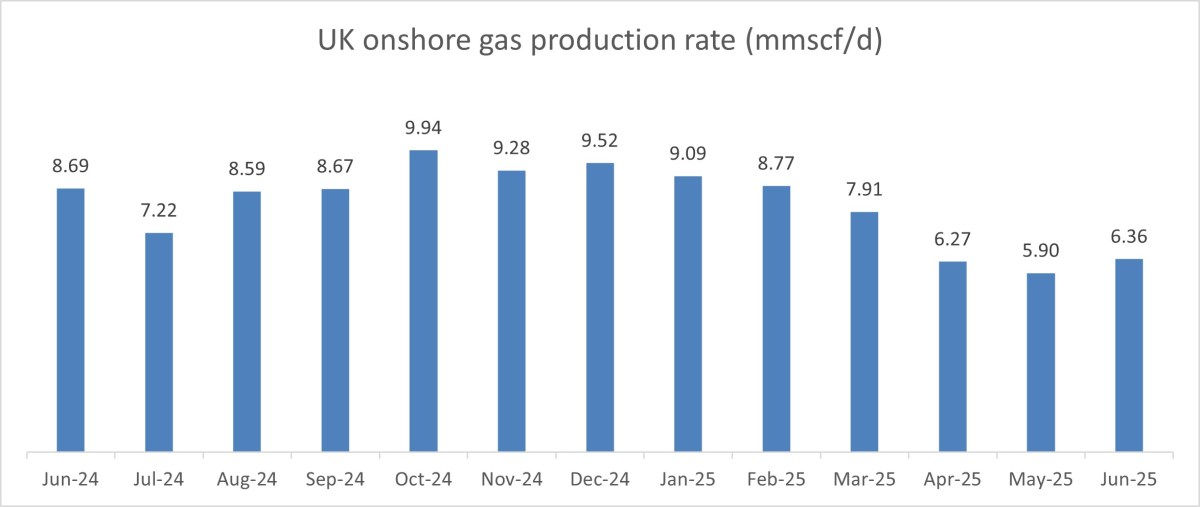
Daily gas production: million standard cubic feet per day (mmscf/d): 6.36mmscf/d
May 2025 5.90mmscf/d, April 2025 6.27mmscf/d, March 2025 7.91mmscf/d, February 2025 8.77mmscf/d, January 2025 9.09mmscf/d, December 2024 9.52 mmscf/d, November 2024 9.28 mmscf/d, October 2024 9.94 mmscf/d, September 2024 8.67 mmscf/d, August 2024 8.59 mmscf/d, July 2024 7.22 mmscf/d
Gas volume: thousand standard cubic meters (Ksm3): 5,403ksm3
May 2025 5,178ksm3 , April 2025 5,329ksm3, March 2025 6,948ksm3, February 2025 6,952ksm3, January 2025 7,982ksm3, December 2024 8,356ksm3, November 2024 7,882ksm3, October 2024 8,726Ksm3, September 2024 7,367Ksm3, August 2024 7,540Ksm3, July 2024 6,339Ksm3
Gas weight: 4,347 tonnes
May 2025 4,173 tonnes , April 2025 4,266 tonnes, March 2025 5,444 tonnes, February 2025 5,478 tonnes, January 2025 6,273 tonnes, December 2024 6,652 tonnes, November 2024 6,291 tonnes, October 2024 6,861 tonnes, September 2024 6,034 tonnes, August 2024 6,186 tonnes, July 2024 5,143 tonnes
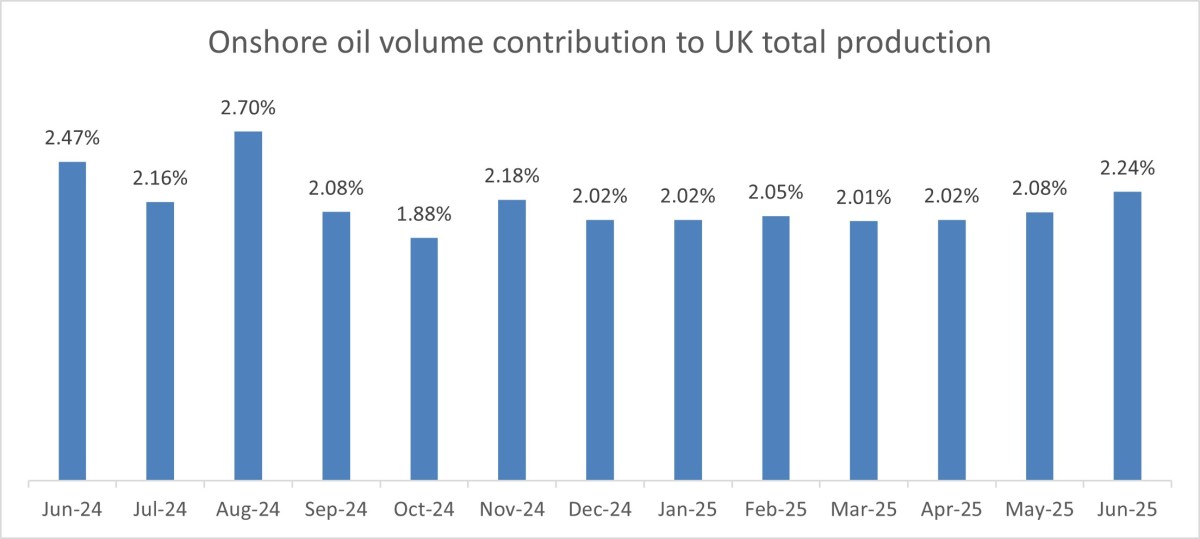
Onshore oil’s contribution to UK total production: 2.24%
May 2025 2.08% , April 2025 2.02%, March 2025 2.01%, February 2025 2.05%, January 2025 2.02%, December 2024 2.02%, November 2024 2.18%, October 2024 1.88%, September 2024 2.08%, August 2024 2.70%, July 2024 2.16%
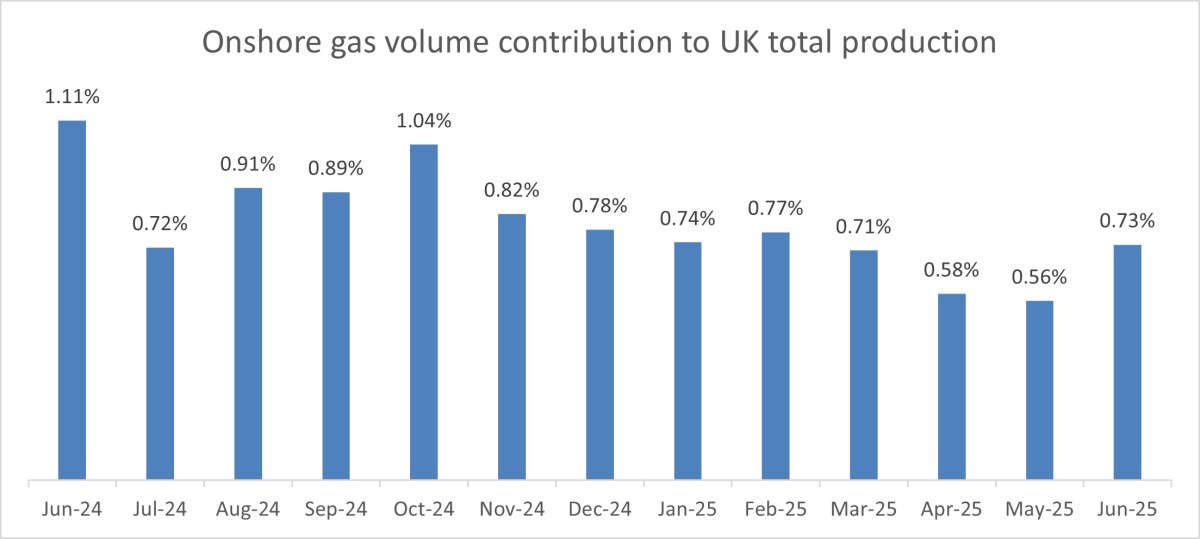
Onshore gas’s contribution to UK total production: 0.73%
May 2025 0.56% , April 2025 0.58%, March 2025 0.71%, February 2025 0.77%, January 2025 0.74%, December 2024 0.78%, November 2024 0.82%, October 2024 1.04%, September 2024 0.89%, August 2024 0.91%, July 2024 0.72%
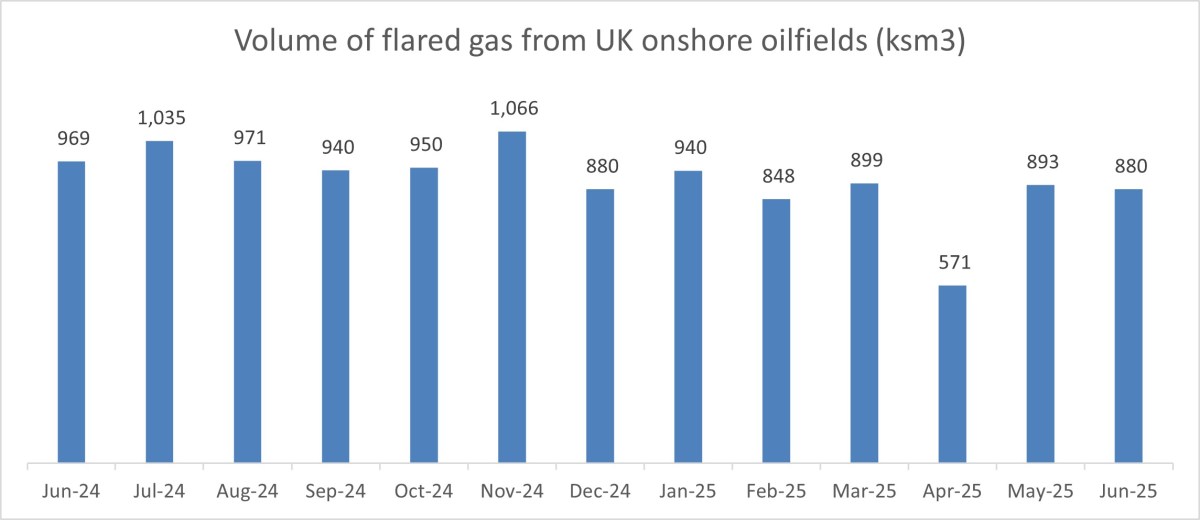
Volume of flared gas at UK onshore oil fields: 880ksm3
May 2025 893ksm3, April 2025 571ksm3, March 2025 899ksm3, February 2025 848ksm3, January 2025 940ksm3, December 2024 880ksm3, November 2024 1,067m3, October 2024 951 ksm3, September 2024 943 ksm3, August 2024 975 ksm3, July 2024 1,035ksm3
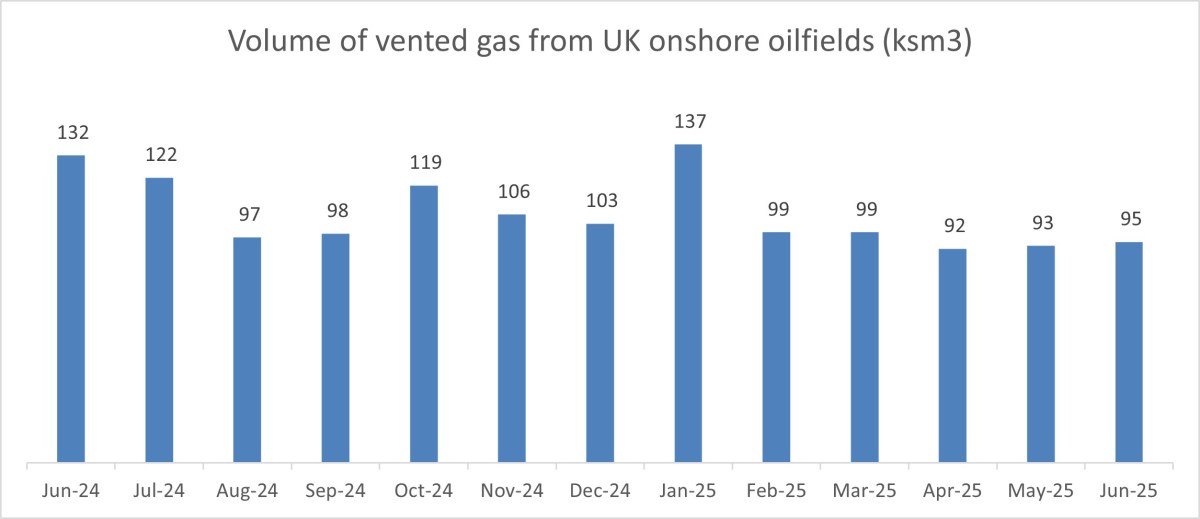
Volume of vented gas at UK onshore oil fields: 95ksm3
May 2025 91ksm3, April 2025 90ksm3, March 2025 98ksm3, February 2025 98ksm3, January 2025 135ksm3, December 2024 103ksm3, November 2024 106ksm3, October 2024 119 ksm3, September 2024 98ksm3, August 2024 100ksm3, July 2024 123ksm3
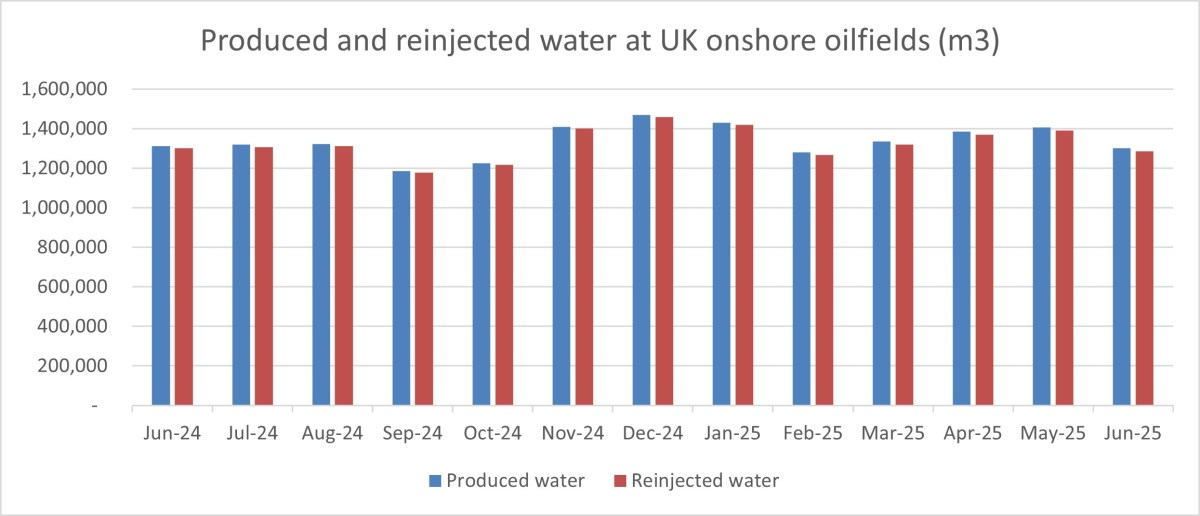
Volume of produced water at UK onshore oil fields: 1,300,308m3
New data field – we will add past data in the coming months. May 2025 1,406,011m3 , April 20251,385,532m3, March 2025 1,335,865m3, February 2025 1,280,605m3
Volume of reinjected produced water at UK onshore oil fields: 1,285,614m3
New data field – we will add past data in the coming months. May 2025 1,389989m3 , April 2025 1,370,247m3, March 2025 1,319,683m3, February 2025 1,266,963m3
Volume of produced water at UK onshore gas fields: 175m3
New data field – we will add past data in the coming months. May 2025 179m3 , April 2025 137m3, March 2025 187m3, February 2025 176m3
Number of onshore fields which recorded some oil production in June 2025: 26
April 2025 29, March 2025 29, February 2025 29, January 2025 29, December 2024 29, November 2024 30,October 2024 30, September 2024 31, August 2024 31, July 2024 31
Number of onshore fields which recorded some gas production in June 2025: 10
May 2025 8, April 2025 11, March 2025 12, February 2025 14, January 2025 15, December 2024 15, November 2024 11, October 2024 13, September 2024 8, August 2024 7, July 2024 8
Number of onshore producing fields which recorded no oil production in June 2025: 17
May 2025 16, April 2025 14, March 2025 13, February 2025 14, January 2025 14, December 2024 14, November 2024 13, October 2024 13, September 2024 12, August 2024 12, July 2024 12
Number of onshore producing fields which recorded no gas production in June 2025: 15
May 2025 17 , April 2025 14, March 2025 13, February 2025: 11, January 2025 11, December 2024 10, November 2024 15, October 2024 13, September 2024 17, August 2024 18, July 2024 16
This article uses data compiled and published by the North Sea Transition Authority (NSTA) from reports by oil and gas companies. This is published about three months in arrears. All the charts are based on the NSTA data. Occasionally, figures change retrospectively.
Details
Daily production
Volume and weight


Contribution to total UK production
Flaring and venting
Produced and reinjected water
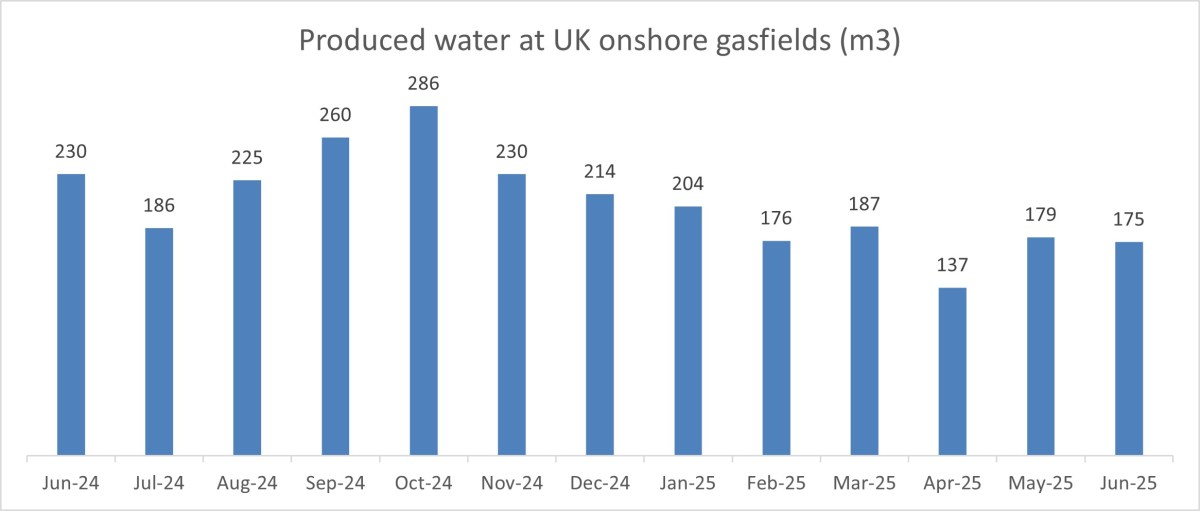
The data shows no reinjected water at onshore gasfields
Producing fields
Oil

Gas
Non-producing fields
Oil
The June 2025 data shows there was no production at 17 UK onshore oilfields. This was one more than in May 2025. Rempstone, near Loughborough, recorded no production in June 2025.
The non-producing fields were again:
- Angus Energy: Lidsey
- Britnrg Limited: Newton-on-Trent
- EP UK Investments: Humbly Grove
- Heyco (formerly Egdon Resources): Dukes Wood, Fiskerton Airfield, Kirklington, Waddock Cross
- HHDL/UKOG: Horse Hill
- Perenco: Kimmeridge
- Star Enery (formerly IGas): Avington, Beckingham West, Egmanton, Nettleham, Rempstone, Scampton, South Leverton, Stainton
Gas
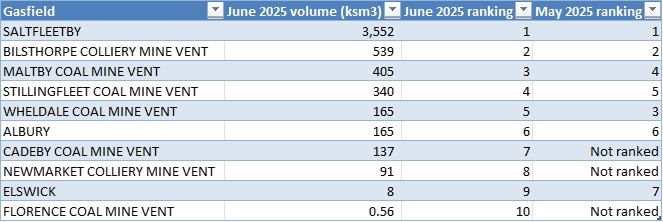
There was no production from 15 onshore fields in June 2025, according to the data. This was two down on May 2025. Cadeby, Florence and Newmarket coal mine vents produced in June 2025 after no production in May 2025. Warsop coal mine vent had produced gas in May 2025 but none in June 2025
The non-producing fields were:
- Heyco: Kirkleatham
- EP UK Investments: Humbly Grove
- Ineos: Airth, Doe Green
- Infinis Energy: coal mine vents at Askern, Bevercotes, Gedling, Kings Mill Hospital, Mansfield, Markham, Prince of Wales, Sherwood, Warsop and Whitwell
- Scottish Power: Hatfield Moor
Operators
Oil

Gas
2022-2025 onshore data archive
August 2022 – see note about revised data
July 2022 – see note about revised data

